Maritime charts
All over the world, nautical charts use the same conventions specified by the International Hydrographic Organization. The major symbols and abbreviations are identical. Some colors and some written abbreviations vary with the country and language.
For American waters, in 2013 the federal government announced that it would no longer print traditional paper charts. However official charts are free online to read, download, use on electronic devices or print at home, courtesy of the National Oceanic & Atmospheric Administration. See the NOAA Office of Coast Survey's BookletChart page. The NOAA booklet "Chart No 1: Nautical Symbols and Abbreviations" can also be downloaded free from the NOAA's Office of Coast Survey website. Last time we looked, the link was at www.nauticalcharts.noaa.gov/mcd/chartno1.htm
For Canadian waters, the official chartmaker is the Canadian Hydrographic Service. They don't sell or give away charts but on their website you can identify the chart you need and find a dealer. You can buy the booklet "Chart No. 1: Symbols, Abbreviations, and Terms Used on Nautical Charts" or download it free from the CHS website.
If you are in an area that is also popular with users of sailboats and powerboats you could use a leisure chart from an independent publisher. These have more information about the layout of small inlets and harbors, whether the foreshore is sand or mud, and the location of waterside stores, and they often include a simple tidal atlas of the area. A marine supply store will stock the charts for the local area and will be able to order charts for other regions. You can get others by mail order. See Retail Outlets.
Maps & charts compared
Ideally a sea kayaker will have both a suitable map and maritime chart covering any unfamiliar area (s)he intends to explore. A chart shows the depth of the sea, gives some information about currents, and shows navigation marks and maritime hazards such as shipping channels and military exclusion zones. This imaginary chart extract shows an area with unusually strong tidal streams, as you can tell from the tidal stream arrow and the symbols marking powerful back eddies and overfalls.
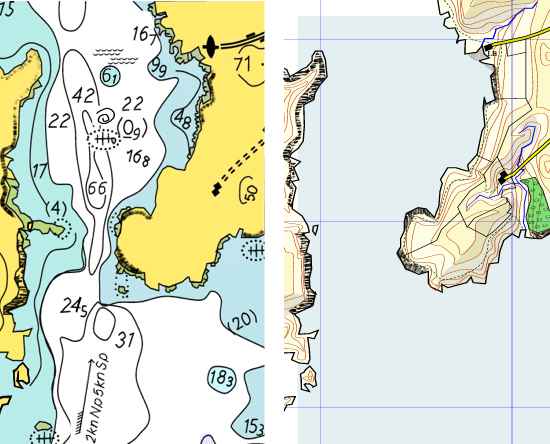
On a map the sea is shown in plain blue with no indication of depth, and only a hint about the places where sand or mud will be exposed at low tide. The shape of the land is shown very clearly with contour lines which join points of equal height. Where the contour lines are close together, the slope is steep. The shape of the land is also shown on this map by darker coloring for higher land, spot heights and conventional "shadows", and more information is given about land features. This makes it easy to identify a landmark such as a village, bridge, island, wood or mountain. If you can identify a landmark, you can easily find your own position at sea.
Kayakers and hikers seldom go long distances so they prefer their charts and maps to be on quite large scale. 1:50,000 is usually fine for both hiking and sea kayaking. A 1:25,000 map will show more detail, including rock outcrops, vegetation, paths, fence lines and campgrounds. A 1:25,000 chart has more space to show features and hazards that may affect small craft.
| America | Elsewhere | |
| Hiking, normal sea kayaking | 1:63,360 (1 inch = 1 statute mile) or 1:50,000 or 1:40,000. | 1:50,000 (1 inch = 0.8 land miles) |
| Mountaineering, kayaking in area with fast currents or complex topography | 1:24,000 (1 inch = 2,000 feet / 0.379 land miles) | 1:25,000 (1 inch = 0.4 land miles) |
| Detailed harbor plans | 1:10,000 or larger | 1:10,000 or larger |
On a map or chart with a much smaller scale than 1:50,000 your entire day trip may fit into a 2-inch square. For sea kayaking in a remote area you may be unable to get a chart on a larger scale than 1:75,000. See also Distances On A Chart.
Below you will see an extract from a chart of a popular kayaking area. It happens to be in Wales but the layout, symbols and abbreviations are almost identical with those on US and Canadian charts. It covers the tip of Pembrokeshire, an area with excellent scenery and wildlife, strong tidal currents which create challenging sea conditions, surf beaches, and plenty of nice pubs and walks if it's too windy for kayaking. It also has some truly exceptional hazards for the sea kayaker.
The extract is about one-thirtieth of the whole paper chart. On paper this extract is 6 inches wide. The scale is 1:75,000 so the area covered is a little over 6 nautical miles wide.
For a higher-resolution image, click here.
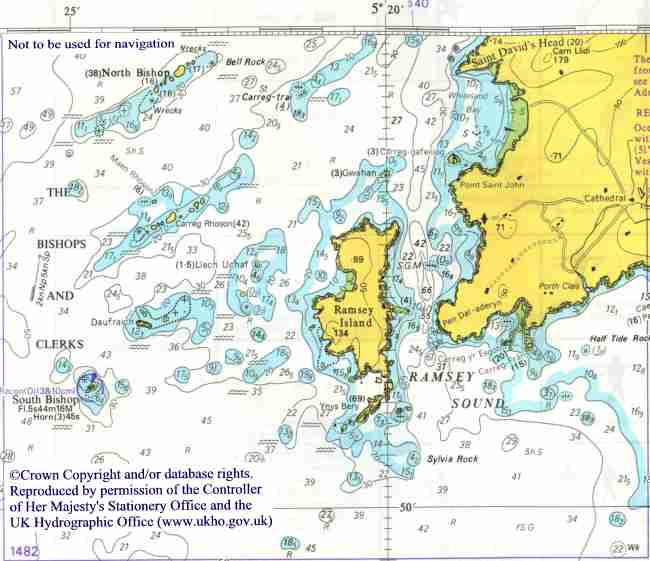
To the west you will see a dozen islands called the Bishops & Clerks. The South Bishop is one of the largest, and has just enough room for a lighthouse.
This part of the chart has no tidal diamonds. Exceptionally, because there are very fast currents in the area covered by the chart extract, there is a tidal stream arrow halfway up the left side. The arrow has feathers, showing that it indicates the direction of the incoming tide at that location. It states that the flood tide flows at 2 knots during neap tides and 5 knots during spring tides.
The sea around the Bishops & Clerks and in the channel between them and Ramsey Island is littered with the twin wiggly lines that mean overfalls and tide rips. That's useful information for a kayaker, enabling you to avoid them either by a sprint across, by going at neap tides, or by crossing the channel at slack tide. In general, see Tides.
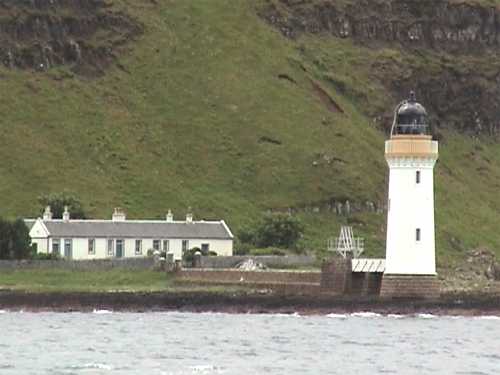
The most striking landmark is the St Davids lifeboat station at St Justinian, located just south of Point St John. It's a white building with a red roof which stands on high concrete legs and has a long, steep ramp for launching the lifeboat. The only sign of it on the chart is a small black symbol consisting of two cones stuck together end to end. (OK, it does look just like the Dagger Kayaks logo!)
The magenta box on the chart and the number 1482 indicates that UKHO also publishes a 1:25,000 chart covering only that area. This would be very useful for a kayaker making a first visit to this challenging region.
For more about what charts do show, see Features On A Chart.
What a chart does not show
Charts are intended mainly for use by ships and yachts so they have very little information about roads, parking lots and paths, and they leave out many things which a kayaker would regard as a maritime hazard.
For example if a headland thrusts out a long way into the sea, it can create a small tide race or turbulent eddyline which is nothing to a ship but troubling to a beginner or intermediate kayaker. Likewise, an underwater reef running out 15 feet from the tip of a headland won't be on the chart, but in a big swell it may unexpectedly create a breaking wave large enough to capsize or loop a kayaker. Another entertaining hazard you may encounter is the blowhole, in the form of a long thin horizontal tunnel into the base of a cliff. When the swell runs into one and fills it up, it may eject a horizontal jet of mixed air and water with the strength of a fire hose. Not on the chart.
An experienced sea kayaker who knows the speed of tidal currents in the area can look at a map or chart and accurately fill in a lot of information by guesswork. See the Reef Point illustrations at Kayaking On Fast-Moving Water.
The 1:75,000 Pembrokeshire chart extract we have used as our example does not show:
• The B-tches, which are either a serious hazard or a white water playspot depending on the state of the tide and your point of view. A line of little islands with shallow water between them, they are not named on the chart but appear as a green finger sticking out of the east coast of Ramsey Island. The green color indicates that at very low tides you can walk dry-shod along the line of islands.
• The Horse Rock whirlpool, which is that very, very rare thing, a whirlpool that can take down a sea kayak. Horse Rock is not named on this 1:75,000 chart but it is shown as a tiny round dot in the middle of Ramsey Sound, just east of the deep water channel. The chart indicates that it is exposed at very low tides. Its drying height is marked as 0.9 meters above the level of the lowest tides. Note the ship wreck marked immediately alongside it.
•. Information about the shape and height of the land. It is often possible to identify an island or section of coast by its shape. On a map, relief is shown by contour lines, by different colors used for land of different heights, by symbols for cliffs, etc, and sometimes by overprinting shadows to give a three-dimensional effect. On a chart, the land is usually shown in one color, and contour lines are either omitted or given only at intervals which are too large to be much use.
• The nature of the shoreline. You can't see them on the 1:75,000 chart, unless you use a magnifying glass and some imagination, but there are low to medium cliffs right round the coast except at Whitesands Bay and Porth Clais, with the occasional low-tide-only beach.
• Paths you could use to get up from the water in emergency.
• Most of the farms, campgrounds and homes that might be useful in an emergency.
• The St Justinian car park and steps down to the beach.
• The Whitesands beach car park and café.
• The small town of St Davids, which surrounds the cathedral marked halfway up the right side of the extract.
For those things, you need to look at a 1:50,000 or maybe 1:25,000 chart alongside a pilot guide and the 1:50,000 map.
 The compass rose in the image has writing along the magnetic north line which says "5 degrees 10 minutes W 2001 (9 minutes E)". The figure in brackets is the annual variation. To find the