This picture is courtesy of Murty Campbell and Stornoway Canoe Club.
 |
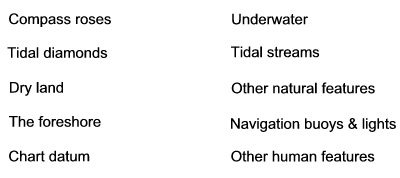
Features on a chart
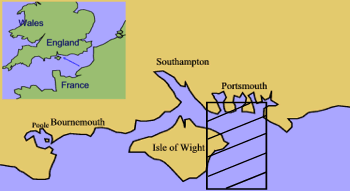 For our example we use the Solent in England, because there's a high-resolution image of the chart online at www.qhmportsmouth.com
"Eastern Approaches to the Solent" covers the area shown cross-hatched on this large scale map. The only thing missing is the degree/minute scale which you would normally find along the vertical and horizontal edges. Last time we looked, the link had gone from the QHM's website but the chart extract was still available here: Wayback Archive. You can easily download it onto your computer. If it's no longer there when you read this, please let us know and use the example at Maps & Charts Compared.
Background
The Solent is the channel between the Isle of Wight and the English mainland. Tidal streams run quite fast in the western arm, which is scenic and unspoiled, bordered on the north by the New Forest and salt marshes and on the south by chalk cliffs and sea stacks called The Needles. There are several places in the western Solent where a kayaker would not want to be caught with a strong wind in the wrong direction, and where mis-reading the tides could mean a long walk back to where you parked your car.
The eastern Solent shown in the chart is deeper, a little more sheltered from the prevailing south-westerly winds and has scarcely anything in the way of natural hazards. However it is a very busy commercial waterway so it is a good idea to have not only the chart but also a pilot book with details of local regulations.
 If you intend to enter or cross Portsmouth's busy naval harbor, you will need a VHF radio to get the permission of HM Harbourmaster.
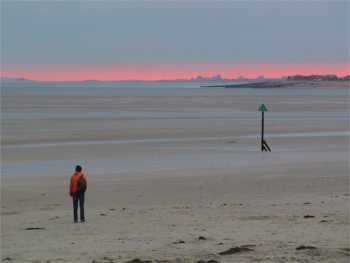
The area covered by the chart includes the approaches to three major harbors and the quieter yachting harbor of Chichester. In the east is West Wittering beach, a popular windsurfing venue where the tide goes out a long way, as you can see from the photo.
The eastern Solent is the main route to Portsmouth naval harbor which is in the north-west corner.
It is also the main route to two other harbors which are off the chart to the north-west. Southampton is an international ferry and container port. Cowes, on the Isle of Wight, is one of the world's busiest yacht harbors.
Compass roses
Compass roses like this one are a handy way of showing true and magnetic bearings on a chart. This chart has five. They show a magnetic variation in 2005 of only 2 degrees 40 minutes and decreasing by 8 minutes per year; part of the line of 1 degree west longitude. So, even in 2005 few sea kayakers would have bothered to adjust their calculations for magnetic variation and by 2011 there was no point doing so.
Tidal diamonds
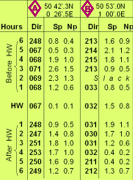 The best source of tidal stream information is a current atlas but most charts worldwide have a few "tidal diamonds". They are symbols printed in magenta and containing a letter or number which refers to a tidal stream table in the margin. The table states the speed and direction of the tide at that location at various times before and after the time of local high tide.
US charts on larger scales seldom have tidal diamonds but the same data can be found on the NOAA's Tidal Current Predictions pages.
There are quite a lot of tidal diamonds on this extract. Have a look at diamond T in the narrowest part of the entrance to Langstone Harbour. It shows a north-going tidal stream of 3.4 knots two hours before high water, during spring tides. Diamond L, which is in the middle of the eastern Solent, shows a maximum speed of 1.8 knots at spring tides, but always less than 1 knot at neaps.
Dry land
Dry land is shown colored buff. In the US, charts prepared by the National Ocean Service (NOS) show dry land in buff but the National Imagery & Mapping Agency (NIMA) prefers gray.
Some information is given about heights, highways and buildings, mainly those which are visible from the sea. Chalk cliffs nearly 100 meters (330 feet) high are marked on the Isle of Wight. The mainland, to the north, is very low-lying, although this is hard to see because it has been over-printed with written information.
Most charts indicate the nature of coastal vegetation such as marsh or mangrove swamp, and a few indicate woods, cultivated land, etc.
The foreshore
Foreshore is anything which is under water for part of the day. It may be a beach, a rock shelf or just mud.
On most charts the foreshore down to low water line is shown in plain green. If the perimeter is shown jagged the foreshore is rocky. If the perimeter is smooth the foreshore is probably a beach, but if you want to know whether that beach is sand, gravel or mud you must look for a typed description or an abbreviation such as S, G or M. Even a chart on a fairly large scale such as 1:25,000 may not indicate what the foreshore is made of.
The "drying height" of parts of the foreshore may be shown underlined. On a metric chart it is in meters and tenths of a meter above chart datum. For example, 06 means that at dead low water during spring tides, as much as 60 centimeters of that part of the foreshore may be above water. The same method is used to show isolated areas of rock, sand or mud which dry out at low tide.
Chart datum
Heights and depths on a chart are measured from conventional levels.
The chart datum used for depths and drying heights is some variant of sea level at low tide. Chart datum for the Solent chart is the Lowest Astronomical Tide (LAT), which means the lowest tide that is ever produced by the action of the sun and moon alone. It is more or less the level of low tide during equinoctial spring tides, which happen a couple of times a year and go slightly lower than ordinary spring tides. See Spring-Neap Tides. US charts may use Mean Lower Low Water, which is approximately the same thing.
Underwater
Depths (soundings) are measured downwards from chart datum.
On most charts they are given in in meters, usually both as contour lines and spot depths in meters and tenths of a meter. A meter is just over 3 feet. US chartmakers started using metric soundings in 1972 but many US coastal charts still have soundings in feet and fathoms. A fathom is 6 feet.
For convenience, most charts also show depths in different colors. Typically, mid-blue is used for water less than 5 or 6 meters (16 or 20 feet) deep and pale blue for water down to 10 meters or 30 feet.
Shoals which are always under water are shown with their spot depth below chart datum. Shoals are isolated banks of mud or sand. The soft version of a reef, you might say. If part is above water at the Lowest Astronomical Tide, it will be marked in the same way as foreshore.
Kelp or coral will probably be marked on the chart. The more traditional chart-makers go into detail about the sea bed (for example sand, mud, clay, silt, shell, ooze, rocky, etc). Useful if you are planning to anchor, or if you carry a lead line. The lead weight has a dimple in the bottom. Fill the dimple with tallow, sling the weight over the side, haul it back in and see what's stuck to the tallow. Yo, ho, ho.
Tidal streams
A large tidal range means strong tidal streams. Like the coasts of British Columbia, Newfoundland and New Zealand, Britain has a large tidal range. If you hold the Solent chart at arm's length, you can immediately see six places where at times you can expect fast currents or a rough sea. Three of these places are the narrow entrances to large natural harbors. Clearly the tide must rush through these four times a day as each harbor fills and empties.
From the chart and a current atlas, we would also expect the exposed deep-water headland of Gilkicker Point (in the north-west part of the chart) and the shallow and exposed area of Bembridge Ledge (off the eastern tip of the Isle of Wight) to be awkward for a kayak when the tidal stream is opposed by a wind of Force 4 or more. In fact, at low tide and with a big swell running, surf breaks on Bembridge Ledge.
The sixth place likely to have strong tidal currents is on a larger scale. Note the shallow water which extends north from the Isle of Wight and south from the mainland leaving only a narrow channel between No Mans Land fort and Horse Sand fort. The current in the narrows sometimes exceeds 2 knots. The chart plainly shows that the channel here is constricted so you would expect fairly fast tidal streams on the middle of the ebb and flood and possibly some turbulence in the shallower water inshore of the forts. The chart advises anybody entering this area to use "extreme caution... as large vessels... with limited manoeuvrability may be encountered". A combination which will make a beginner anxious. However let's not exaggerate - the forts give you a clear target to aim at and the channel is only 1 nautical mile wide so you can cross it in 15 or 20 minutes.
Other natural features
There are several beaches where the tide goes out nearly a mile at spring tides.
The top of the chart gives a written warning that large waves may break on the sandbars at the mouths of Chichester Harbour and Langstone Harbour when there is a strong onshore wind. See Waves At A River Mouth.
Navigation buoys & lights
Many navigation buoys are shown and described on the chart. Since the Solent is in Europe their colors and shapes comply with the IALA-A system of buoyage. See Navigation Marks.
Look at Horse Sand fort. It is marked with a little magenta teardrop and the letters Iso.G.2s.21m8M, which tells us that at night it shows a light with five characteristics for easy recognition. We touched on this at Night Navigation Marks.
1. A light can be on continuously (F for fixed) but most of them flash. On a chart, Fl means flashing (dark period is longer than lit period). Q means quick (50-79 flashes per minute); VQ means very quick (80-159 per minute). UQ means ultra quick (160 or more per minute). LFl means long flashing (each flash lasting at least 2 seconds). A few lights are isophase, with equal periods of light and dark. A few are occulting, which means they are on most of the time but go dark in a fixed pattern.
2. Lights are usually green (G) or red (R) but may also be white (W), yellow (Y) or in pairs, for example WR.
3. The period of the light is given in seconds. The period is the time from the start of one cycle to the start of the next. A lighthouse, for example, might flash three times in six seconds and then be dark for nine seconds, giving it a period of 15 seconds.
4. Finally the height of the light is stated in meters, followed by the distance in nautical miles from which it is visible on a clear night.
The light on Horse Sand Fort is green, isophase, with a 2 second period so one second of light alternating with one second of darkness. It is 21 meters (70 feet) above high water level, and is visible up to 8 miles away on a clear night. Compare with No Mans Land fort which is Iso.R.2s.21m8M. Exactly the same, but red. The chart shows many light-buoys and their pattern of flashing or occulting.
Other human features
The Solent chart shows an anchorage for Royal Navy warships to the south of Gosport; summer moorings for leisure craft at Seaview on the Isle of Wight plus many marinas and sailing clubs; a castle; four forts on land and four which stand in the sea; a lot of shipwreck sites, including that of the Mary Rose; traffic zones for high speed craft, which the pilot guide says includes hovercraft and fast ferries travelling at 24 knots; the Nab deep water traffic zone; and two naval firing ranges. The top of the chart gives written information about those. There is no restriction on crossing these ranges, because firing only takes place when the areas are "considered to be clear of all shipping"(...!).
There is one enigmatic feature, the "submerged barrier" leading from Portsmouth out to the 1860s fort on Horse Sand. Low underwater walls are usually training walls built to encourage the tide to scour out part of a harbor, but not this time. To find out what this is, you need either local knowledge or a pilot book. Locally known as The Blocks, it was an underwater sea defense built to stop enemy boats from reaching Portsmouth by going behind the fort. It is clear from the chart that it is a hazard to shipping. A "boat passage" is marked at the north end, and the "main passage" in the middle is marked with two flashing lights. One is Q.G. 2M (quick continuous flash, green, 2 meters above high water level) and the other is Q.R. 2M (the same but red). The depth of water alongside the barrier at low tide is 1 meter for much of the way and never more than 2.6 meters. The barrier is good for kayakers because it provides a powerboat-free route to the fort.
Co-ordinates on a chart
Co-ordinates identify a particular point on the globe, by reference to lines of latitude & longitude.
If you look at the bottom left corner of the "Eastern Approaches to the Solent" chart we have been using as our example, you will see its co-ordinates stated as 1 degree, 8 minutes west, and 50 degrees 34 minutes north. 'North' means north of the equator, and 'west' means west of the prime meridian which runs through London. The Solent is almost directly south of London.
Co-ordinates are given latitude first, longitude second. There are 360 degrees in a circle, 60 minutes in a degree and 60 seconds in a minute. If you want accurate co-ordinates, you use all of them. For example 50°34'.98 N, 01°08'.03 W.
Like a six-figure map reference, this defines a very small square. Note that the "northings" and "westings" are the opposite way round to a map grid reference. When giving the co-ordinates of a point on a map, you read the horizontal scale first, then the vertical scale. With a chart, you read the vertical scale first.
As a kayaker, it is unlikely that you will want to calculate co-ordinates except to call the emergency services to your position. Unless you have a GPS device it is better to give your position by reference to a landmark, for example "two miles west of Ardnamurchan Point". See Radio Distress Calls.
Navigation tools ashore
We have mentioned maps, charts, current atlas and tide tables.
You may also find it helpful to buy a sailor's or kayaker's pilot guide for the area. This is usually a book describing local winds, shipping lanes and other navigational topics, illustrated with small charts of harbors on a very large scale and with photos taken from the air and sea. It will have practical information such as "off the point there are tide rips which, with a wind opposing the current, are dangerous to small boats" and "the oyster industry discourages boatmen from entering this area". Older editions of US Coast Pilots, up about 1990, can be downloaded free from the NOAA's Office of Coast Survey. They are intended mainly for commercial shipping but still have much of interest. Last time we looked, the page was here. A pilot guide for leisure users probably also says where you can find supplies, a bar and a camp ground.
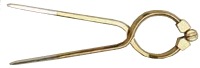 Whether you are planning your journey with a map, chart or both you probably need a pencil and eraser. To measure distances you need a ruler, unless you prefer to use a pair of dividers like these. To measure bearings, which are angles from north, you need some sort of protractor.
A topographical map is overlaid with a grid of north-south and east-west lines. To find the bearing of a line linking point X and point Y, you just measure the angle where the line crosses any of the north-south grid lines. As the grid lines are printed quite close together, you don't need a large protractor. An ordinary orienteering compass with a long, flat plastic baseplate and a rotating bezel makes a good protractor for a map.
Maritime charts have compass roses rather than a printed grid, and the nearest rose may be some distance away from the X-Y line for which you need to calculate a bearing. An orienteering compass is not really enough.
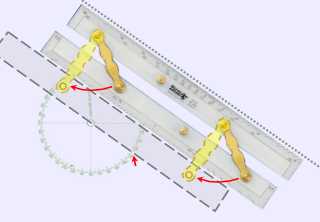 |
For many people, the solution for use at home is the traditional parallel rule. This consists of two transparent plastic rulers attached side by side by two hinges. Put one side of one ruler along your X-Y line. Then hinge the other ruler out until it is on the center of the nearest compass rose, and read the bearing off the outside of the rose. If the nearest rose is too far away, you can "walk" a parallel rule across the chart until you get there. |
 |
Alternatively there are course plotters. These are probably the most popular solution for today's small boat navigators. Some are just square protractors. The kind illustrated here have a rotating bezel and look like a giant's orienteering compass but without the magnetic needle. |
Navigation tools afloat
When you go afloat, you can take along a waterproof chart extract, basic tools, and a note of important data such as the time of high tide, time of slack water, and relevant VHF channels and cellular phone numbers.
Tools. It's always useful to have a wristwatch and often a water-resistant pen or pencil and a handheld compass on a lanyard of thin cord. You can measure distances either with the edge of the compass baseplate or with a piece of thin cord, marked or knotted at intervals of 1 nautical mile. In some circumstances you may also want a whiteboard for making notes, a deck compass and possibly a GPS satellite navigation device.
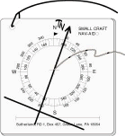 You can't take parallel rules or a regular course plotter because they're too big and awkward. For use on sea kayak decks, Dr Chuck Sutherland has devised a simple miniature alternative (OK, it's bigger than this illustration). The Small Craft Nav-Aid sells for about US$12. It's not really necessary but it is convenient.
For a whiteboard, you could take some cheap white self-adhesive plastic and make two hand-sized patches on the deck, one each side of the front of the cockpit, to record trip information such as the times of high tide and slack water, and VHF channels. You can write on it at sea using a waterproof marker pen or preferably a grease pencil. You may know this better as a china marker or Chinagraph pencil. Alternatively you could take a waterproof notebook or diver's "dive slate".
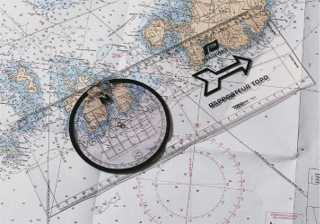
Chart extract. You can take the original sealed in a waterproof map case but many people prefer to leave it ashore and take a photocopy. A good black and white photocopy is OK but color is better. For a map extract it is useful to include the scale in miles. For a chart extract, make sure you include a length of the right or left vertical margin because this is your scale of nautical miles. If there is no compass rose on the relevant part of the chart, draw a line over the chart extract corresponding to magnetic north, and then a grid of lines parallel to it at two-inch intervals. Try to include at least one tidal diamond and the box of data to which the tidal diamond refers.
You can protect your chart extract by covering it in the sort of cheap self-adhesive clear plastic you can buy from a supermarket or stationer. It will stay readable for long enough for you to avoid the hazards (or find them and play in them!). Stick it to the front deck just in front of the cockpit, under your deck elastics. If the chart extract may be crucial to your wellbeing don't just put it under the elastics, stick it to the deck with duct tape.
First, take your chart...
Open your chart at the section which covers your proposed trip. Check whether the height/depth scales are in meters, feet or fathoms. Check the scale of nautical miles on the vertical margin. These are popular scales:
• 1:25,000 - 1 inch = 0.4 land miles. Good for areas with particularly strong tidal streams.
• 1:50,000 - 1 inch = 0.8 land miles. The usual scale for sea kayakers.
• 1:75,000 - 1 inch - 1.18 land miles. Rather a small scale but sometimes all that is available.
For a more intuitive understanding of the scale of this particular chart, look for some features which you already know in real life.
Second, look for a tidal diamond or tidal arrow to tell you the strength and direction of tidal streams in the area where you are going. If there aren't any, buy a current atlas. If you see there will be a tidal stream flowing at 0.1 to 0.5 knots, you can ignore it except when planning a long open-water crossing. If there will be a tidal stream flowing at 0.5 knots to 1 knot, on the typical trip all you need do is remember that kayaking against the tidal stream will take a little longer, and if you kayak across it you will, just as when you kayak across a river, need to keep an eye on your destination and adjust your heading. See Ferry Glides and Ranges.
If there is a tidal stream flowing faster than 1 knot, you may need to do some formal navigation to calculate its effect on your speed and direction. That is particularly so where you intend to make a long open-water crossing when a significant current will be carrying you off to the left or right. You may need to change your plans, putting off the trip until the tides are more favorable.
Third, look for any markings which indicate a problem or hazard. For example, a large area of deep, sticky mud at your launch site which will be exposed at low tide, a submerged reef which might cause big breaking waves when there is a swell running, a military firing range, a shipping lane from which small boats are excluded, or a marine sanctuary with restricted access. Overfalls and tide races are created by tidal streams, so the surface should be calm if you go at slack water and probably fairly calm any time during neap tides.
Fourth, draw a line along your proposed route and find its bearing. Make any necessary adjustment for tidal streams. Check the total distance. Now you know the course you must steer and how long it will take you to get there. Of course there's no need to get hypnotized by the fact that you have plotted a course. When you go afloat, if you can see your destination the best way there is usually just to paddle towards it and do a ferry glide if the current or wind send you off sideways.
Adjusting your plot for currents
You want to go from Mythical Harbor east to Seal Island. If the distance were only a couple of nautical miles it would be enough to check the speed of the tidal stream and just aim your kayak for the island by eye, using ranges to check the effect of wind and current, and using a ferry glide to keep on course. However this is a major open-water crossing which will take several hours and visibility may deteriorate on the way over. More thought is needed.
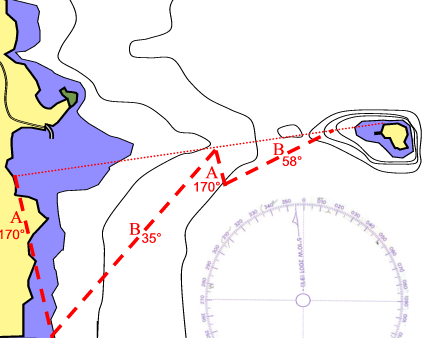 The scale on the vertical sides of the chart tells us that the distance in a straight line is 9 nautical miles.
We already know the bearing is 80 degrees, but we've decided to go at a time when there will be a significant tidal stream. You want to know how long the crossing is likely to take, the most efficient course to take, and what direction to paddle by compass in case of mist or fog. It's a simple matter of plotting a "tidal triangle" or vector on your chart. Here's an example:
Let's assume you will paddle at a constant speed of 3 knots. With no wind or currents, it would take you 3 hours to reach the island.
By the time you have driven to Mythical Harbor, found someplace to park the car, changed clothes and got your kayaks on the water it will be about 10 am. You have referred to tidal data in the form of tide tables and either tidal diamonds on the chart or a current atlas. This shows that there will be a strong current flowing north to south on the day of the trip. You remember to adjust for local summer time if necessary, and you find that for the first two hours of the crossing there will be a current flowing almost due south (in fact 170 degrees magnetic) at 2 knots. For the third hour the current will be in the same direction but only 1 knot, and in the fourth hour it will be down to half a knot.
On your chart, draw a straight line from your departure point to your destination. This is your baseline, which in our example is at 80 degrees from magnetic north. From your departure point draw a line pointing 170 degrees from magnetic north. This is line A. The speed and direction of tidal streams will be the same for the first two hours of the crossing so to save time we can draw a single tidal triangle for both hours.
Two knots for two hours is 4 nautical miles. Measure 4 miles along line A and mark that point. This is what the tide will do in the first two hours. With a pair of dividers, measure 6 nautical miles (the distance your kayak will go through the water in the first two hours). Place one point of the dividers at end of line A furthest from the baseline, and mark where the other point touches the baseline. Draw a line to join the two divider points. This is line B and you have your first tidal triangle. Find the bearing of line B by transferring it to the compass rose. It's 35 degrees magnetic. If you keep your kayak on that heading, after two hours your position should be on the baseline at the point of the first triangle.
Now draw a second triangle using the same baseline, this time just for one hour. Line A is again at 170 degrees but this time it will be only one mile long to reflect the one knot south-going tide. Set your dividers to the distance your kayak will travel in the time, which this time is three nautical miles. Place one point of the dividers at end of line A furthest from the baseline, mark where the other point touches the baseline, draw in line B and find its bearing. It's 58 degrees magnetic, and that will be your course for the third hour.
By the time you reach the point of the second triangle you should easily be able to see your destination even in reduced visibility. For all practical purposes, you can stop your chartwork now because plainly in the fourth hour you can just go in roughly the direction of your baseline for twenty minutes until you get to Seal Island. However if you are feeling mathematical, you could draw a third, shorter triangle and then calculate the total length of all three line Bs. That gives you the total distance to Seal Island, allowing for tidal streams. It's more than 10 nautical miles, where the straight-line distance was 9.
Figures like this can only ever be approximate. You will be doing well if your kayak is actually pointing within 5 degrees of your intended heading and 10 degrees is not bad. Our kayak speed may not be exactly 3 knots through the water. If there is any wind, our course will be affected by leeway. The current may not do exactly what the current atlas predicts, especially if there has been a constant wind for several days as it will create an independent surface current. The small headland north of Mythical Harbour would certainly disturb the flow of the 170 degrees / 2 knot current. It might well create a large back eddy over the whole of the shallow ground east of Mythical Harbour so that the current we encounter for the first mile after launching is flowing north, not south. The only real answers are to make the crossing in conditions of good visibility or buy a GPS.
Note that if you plot a long open crossing with a tidal triangle for every hour, and change course every hour, your real position will always quite close to the baseline. This isn't necessarily faster than just calculating a single course and using that for the entire crossing, but if you have to change your plan halfway over you will know that your actual position is someplace near the baseline. That makes it easier to plot a new course.